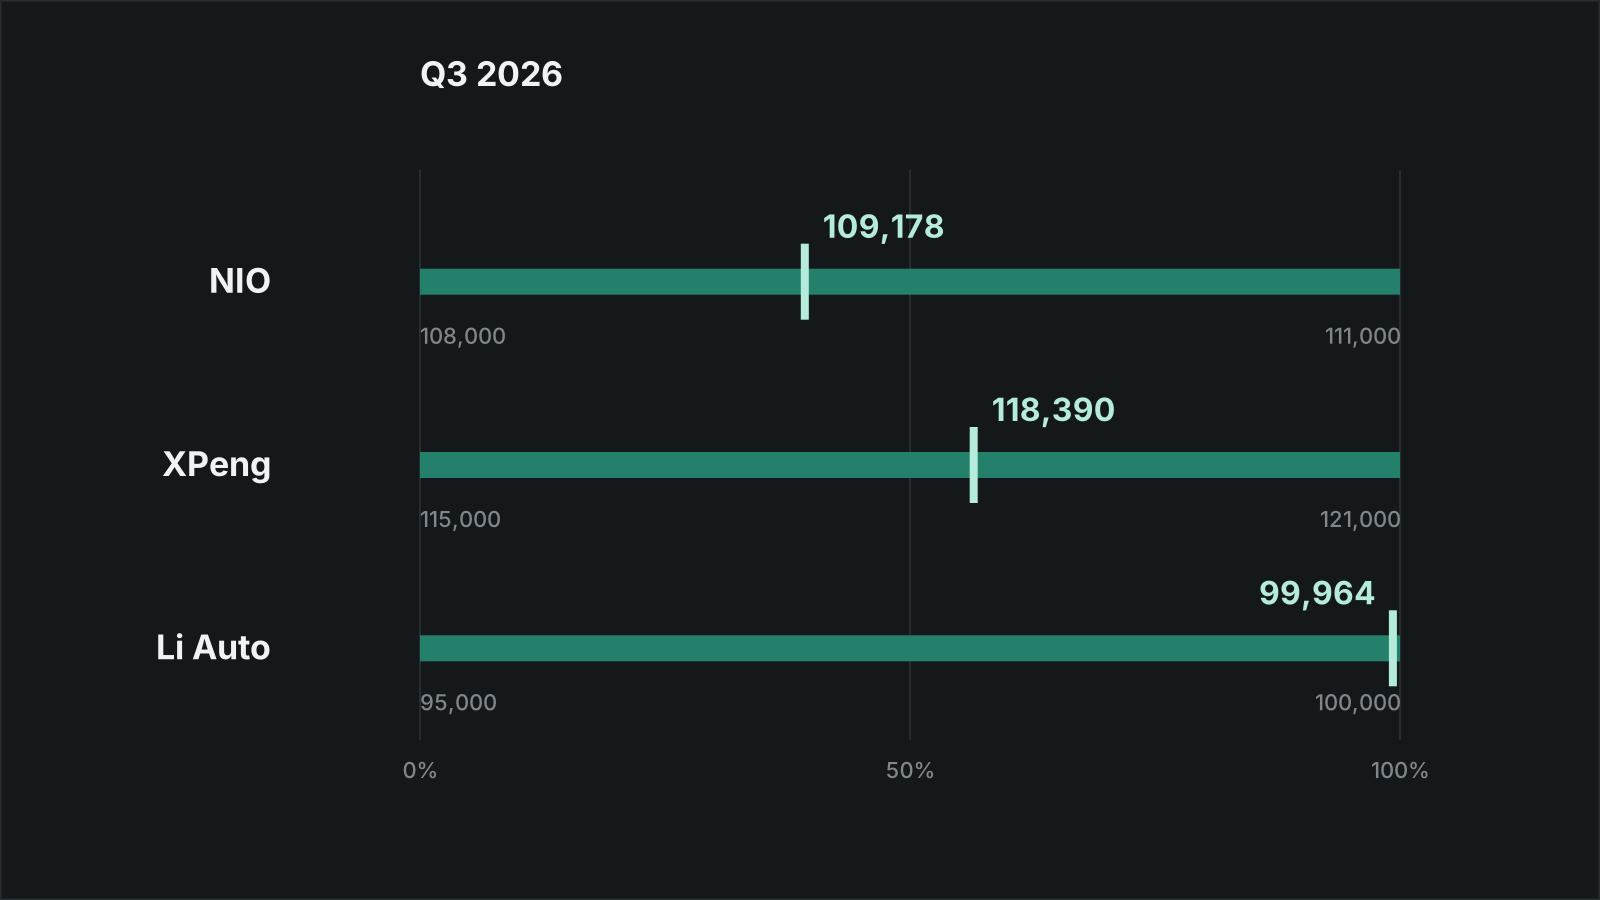
Q3 guidance scorecard: three hits, and Li Auto finished 36 vehicles from its ceiling
NIO, XPeng and Li Auto each delivered inside the third-quarter range they gave. NIO landed 39.3% of the way up its range, XPeng 56.5%, Li Auto 99.3%. All three set their ranges with part of the quarter already delivered.
NIO guided to between 108,000 and 111,000 vehicles for the third quarter and delivered 109,178. XPeng guided to 115,000 to 121,000 and delivered 118,390. Li Auto guided to 95,000 to 100,000 and delivered 99,964. All three hit. That is the headline; the more useful numbers sit underneath it.
| Company | Guided range | Actual | Position in range | Distance |
|---|---|---|---|---|
| NIO | 108,000 to 111,000 | 109,178 | 39.3% | 1,178 over floor |
| XPeng | 115,000 to 121,000 | 118,390 | 56.5% | 3,390 over floor |
| Li Auto | 95,000 to 100,000 | 99,964 | 99.3% | 36 under ceiling |
The range is the other half of the score
Hitting a range says less than it appears to, because ranges differ in width. NIO's was 3,000 vehicles wide, 2.7% of its midpoint. XPeng's was 6,000, 5.1% of its midpoint, and Li Auto's 5,000, 5.1% of its own.
NIO's width is new. Its second-quarter range was 110,000 to 115,000, 5,000 wide, and it delivered 107,658, which is 2,342 below the floor. It then guided a narrower range for the third quarter and landed inside it. A company that missed its last floor and then narrowed its range was making a more precise claim, and this time it held.
A guide set mid-quarter is a guide about the rest of it
None of the three published its range at the start of the quarter. Each arrived in a results release after the quarter had begun: XPeng's on 24 August and Li Auto's on 26 August, both with July delivered, and NIO's on 1 September, the same day as its August figure. Subtract what was already known and each guide becomes a statement about the months that remained.
| Company | Known when guided | Implied rest of Q3 | Delivered | Needed vs last known month |
|---|---|---|---|---|
| XPeng | 38,027 (July) | 76,973 to 82,973 | 80,363 | +1.2% to +9.1% |
| Li Auto | 30,468 (July) | 64,532 to 69,532 | 69,496 | +5.9% to +14.1% |
| NIO | 71,770 (July, August) | 36,230 to 39,230 | 37,408 | +1.1% to +9.5% |
Li Auto needed its two remaining months to average between 5.9% and 14.1% above July, and averaged 14.0% above it. It got there on August, which came in at 37,679, and September then gave back 15.6%. A company that finishes 36 vehicles under its ceiling after a month like that was close to the edge of what its own range allowed. NIO needed September to be 1.1% to 9.5% above August and got 4.4%. XPeng needed 1.2% to 9.1% and got 5.7%.
Revenue guidance cannot be scored yet, and it says something else
The same releases guided revenue. That is scored with the Q3 results, but the percentages the companies attach to it already say something about the car mix, because revenue divided by deliveries is revenue per vehicle.
| Company | Guided deliveries YoY | Guided revenue | Guided revenue YoY | Revenue per vehicle YoY |
|---|---|---|---|---|
| NIO | +24.0% to +27.5% | RMB33.3bn to RMB34.1bn | +52.7% to +56.2% | about +23% |
| XPeng | -0.87% to +4.30% | RMB21.7bn to RMB23.4bn | +6.47% to +14.81% | +7% to +10% |
| Li Auto | +1.9% to +7.3% | RMB26.6bn to RMB28.0bn | -2.8% to +2.3% | about -5% |
Read that way, NIO guided to roughly 23% more revenue per car, XPeng to 7% to 10% more, and Li Auto to about 5% less while guiding volume up. The margin side of that trade is in what EV gross margin actually measures. The Q3 results will say whether the guided mix showed up.
What has not been guided
None of the three Q2 results releases carries a fourth-quarter or full-year delivery figure, and BYD's monthly announcements carry no forecast at all. This scorecard covers what the companies put in writing in their releases. Remarks made on earnings calls may go further, and we have not scored them here.
What can be said without a forecast is how high last year's bar was. Matching the fourth quarter of 2025 would take these changes on the third quarter of 2026:
| Company | Q4 2025 | Q3 2026 | Change to match Q4 2025 |
|---|---|---|---|
| NIO | 124,807 | 109,178 | +14.3% |
| Li Auto | 109,194 | 99,964 | +9.2% |
| BYD | 1,342,290 | 1,323,065 | +1.5% |
| XPeng | 116,249 | 118,390 | -1.8% |
XPeng has already delivered more than it did in last year's fourth quarter. NIO would need the largest step up. The first fourth-quarter ranges should arrive with the Q3 results; if each release follows the pattern of the Q2 ones, this scorecard will have a Q4 row.
For the quarter itself, the numbers behind the ranges are in Q3 deliveries: NIO and BYD grew by double digits, XPeng and Li Auto did not.
Sources
- NIO Q2 2026 unaudited financial results (Q3 guidance, 1 September 2026)
- NIO Q1 2026 unaudited financial results (Q2 guidance, 21 May 2026)
- NIO October 2025 delivery update
- NIO November 2025 delivery update
- NIO December 2025 delivery update
- NIO June 2026 delivery update
- NIO July 2026 delivery update
- NIO August 2026 delivery update
- NIO September and third quarter 2026 delivery update
- XPENG Q2 2026 unaudited financial results (Q3 guidance, 24 August 2026)
- XPENG vehicle delivery results for September and Q3 2026
- XPENG Q4 and FY2025 results
- Li Auto Q2 2026 unaudited financial results (Q3 guidance, July 2026 deliveries, delivery history table, 26 August 2026)
- Li Auto August 2026 delivery update
- Li Auto September 2026 delivery update
- BYD production and sales volume announcement, October 2025
- BYD production and sales volume announcement, November 2025
- BYD production and sales volume announcement, December 2025
- BYD production and sales volume announcement, July 2026
- BYD production and sales volume announcement, August 2026
- BYD production and sales volume announcement, September 2026
- Guided ranges and the percentages attached to them are quoted from each company's Q2 results release. Deliveries are from the delivery updates and results releases above. Positions, distances, implied remainders, revenue per vehicle and the changes needed to match Q4 2025 are calculated by Northline Post.
Related reading
Hybrid, plug-in, range extender: where the engine actually connects
Three drivetrains sold under one word. The difference that matters is whether the engine can drive the wheels at all, and how much battery sits behind it.
Updated 17 Sept 2026 · Explainer · 2 min
An electric motor, a petrol engine and a diesel engine, measured on efficiency
The three drivetrains differ in how much of their fuel reaches the wheels, where their torque arrives, and how many parts they need to do it. The efficiency gap is the largest of the three, and the least discussed.
Updated 17 Sept 2026 · Explainer · 2 min
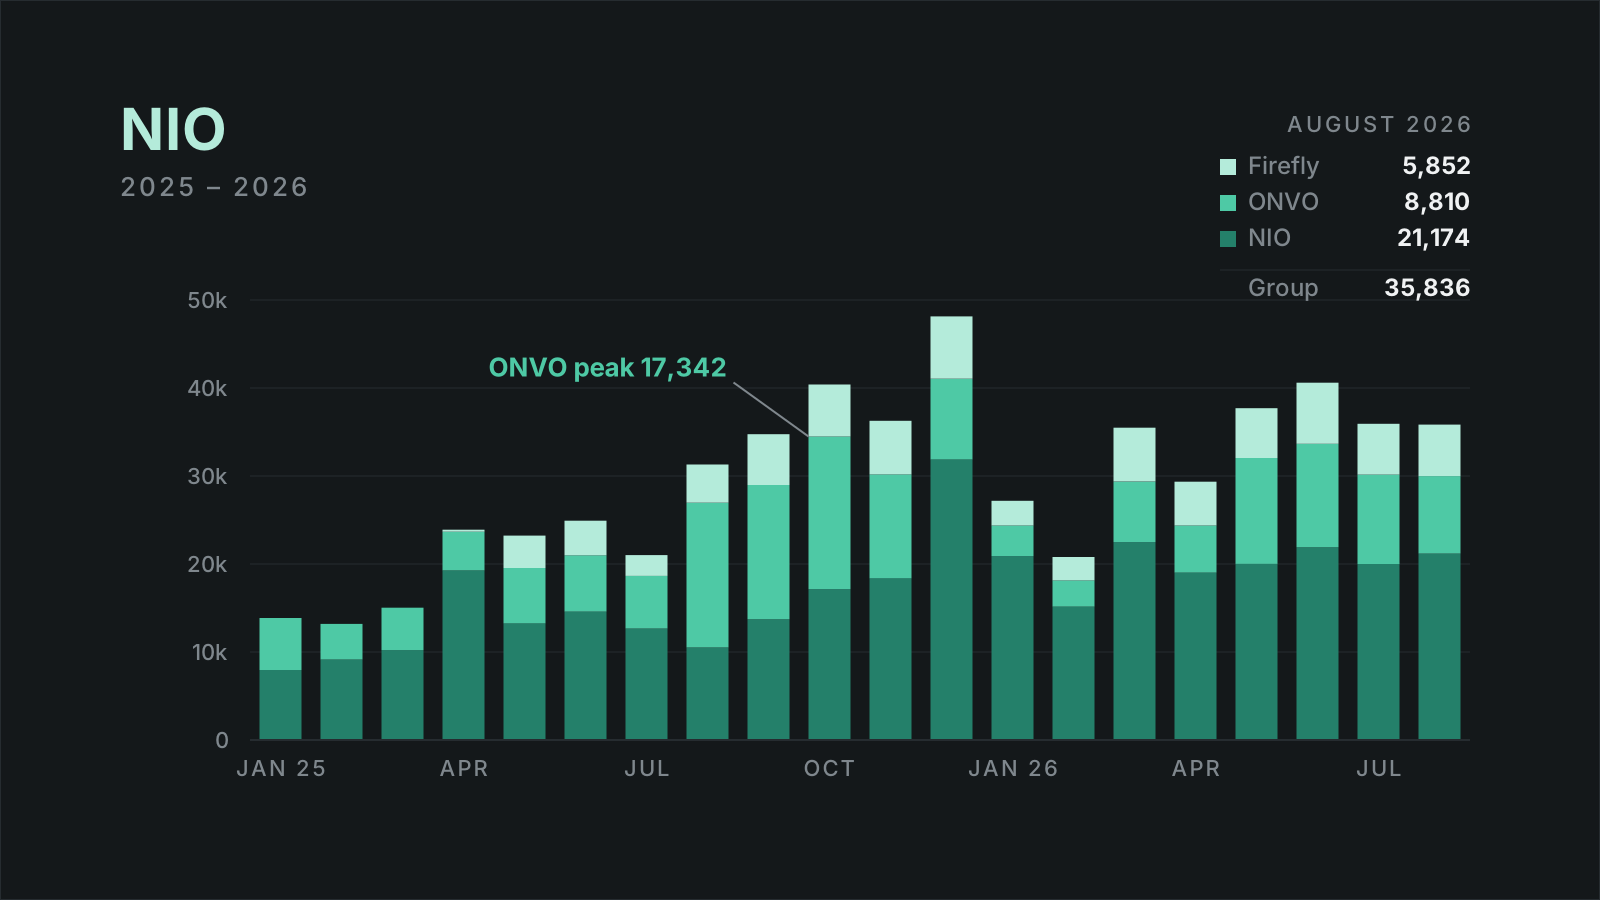
NIO's premium brand is doing the volume brand's job
Group deliveries rose 14.5% in August. Inside that number the expensive brand doubled and the cheap one halved - which is the reverse of what the strategy called for.
12 Sept 2026 · Analysis · 5 min
More on NIO Inc
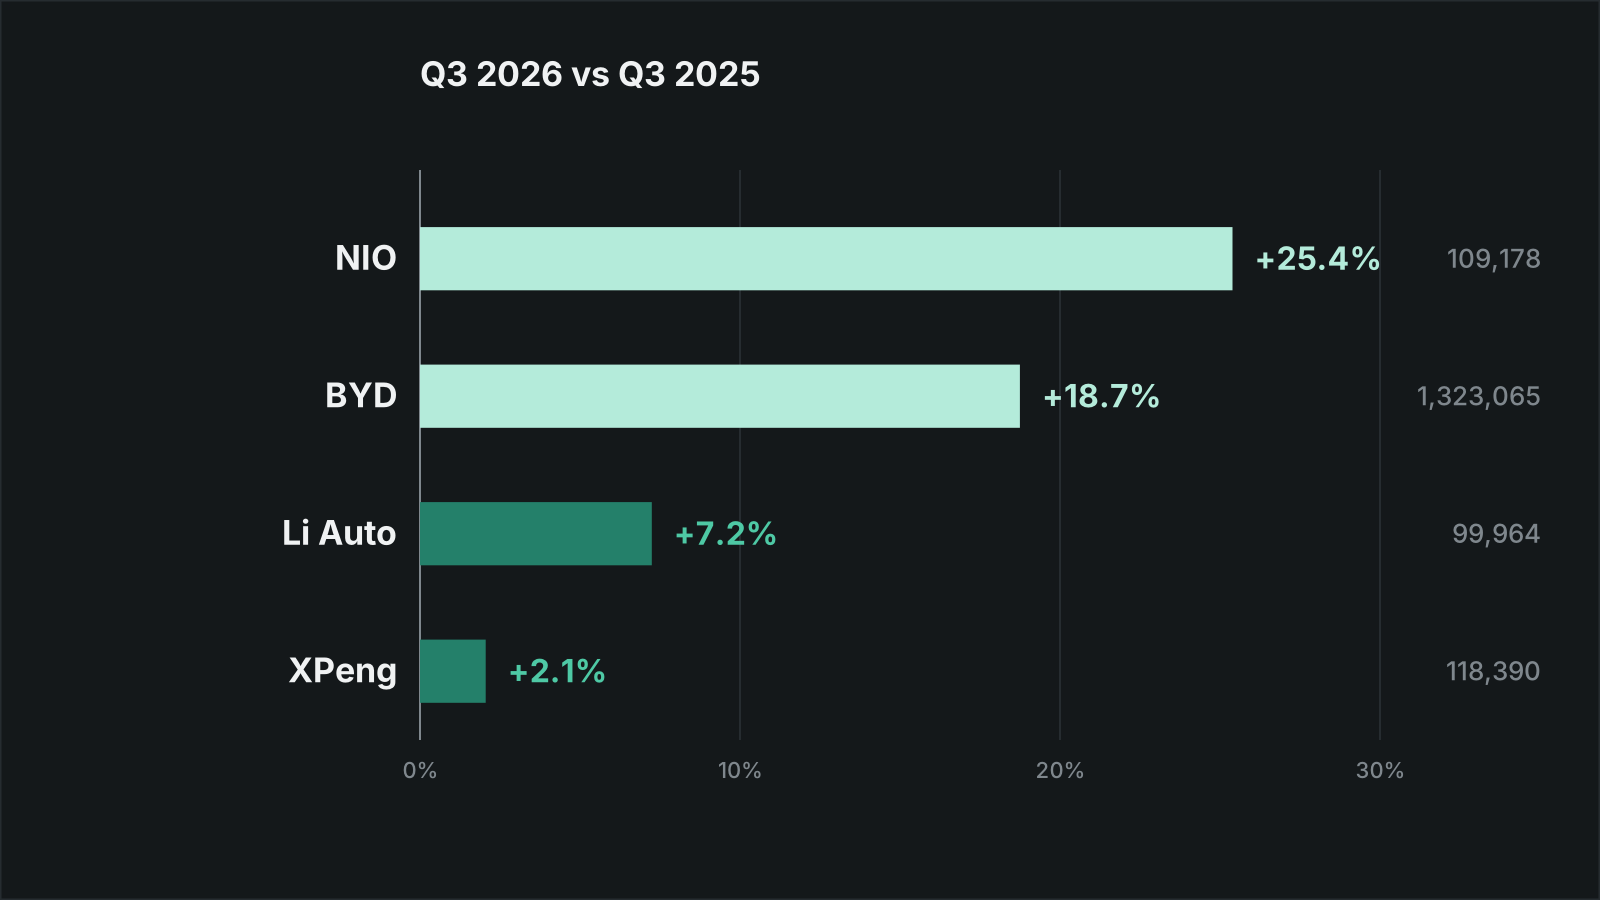
Q3 deliveries: NIO and BYD grew by double digits, XPeng and Li Auto did not
NIO delivered 109,178 vehicles in the third quarter (+25.4%) and BYD sold 1,323,065 (+18.7%). XPeng's 118,390 was up 2.1% and Li Auto's 99,964 up 7.2%. The growth came from NIO's premium brand and BYD's exports.
1 Oct 2026 · Analysis · 6 min
Three range figures, three test cycles, and why you cannot compare them
The same car is rated for different ranges in Europe, China and the United States. The car does not change. The test does, and the gap between the numbers is large enough to change which car looks better.
Updated 17 Sept 2026 · Explainer · 3 min
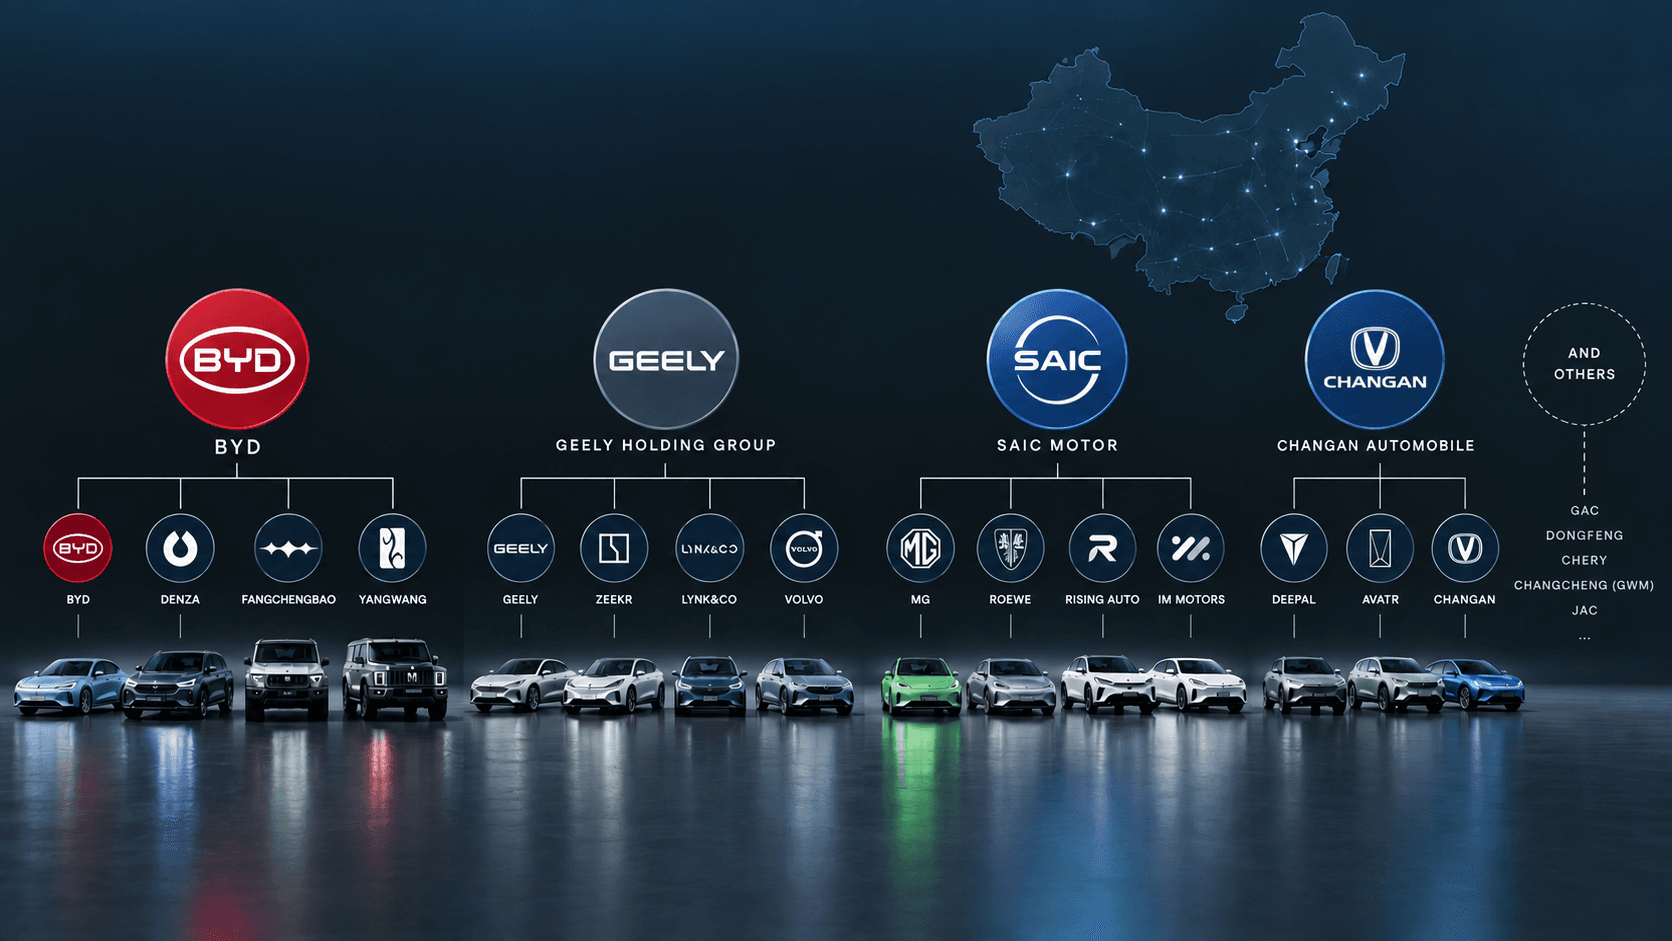
Chinese EV brands: who owns what
Denza, Yangwang, ONVO, MONA, Zeekr, Lynk & Co, MG, Avatr. Most of the names arriving in Europe belong to seven groups, one of which also owns Volvo, and one phone company that owns no carmaker at all.
12 Sept 2026 · Deep dive · 10 min
More on XPeng

What EV gross margin actually measures, and why the Chinese makers report it differently
XPeng's gross margin rose from 17.3% to 20.7% over a year in which its cars got less profitable, not more. Both numbers come from the same filing. Here is how that works.
12 Sept 2026 · Deep dive · 8 min