Three range figures, three test cycles, and why you cannot compare them
The same car is rated for different ranges in Europe, China and the United States. The car does not change. The test does, and the gap between the numbers is large enough to change which car looks better.
A car advertised at 700 km in Shanghai, 600 km in Berlin and 500 miles nowhere at all is not three cars. It is one car, measured three times, under three procedures that disagree about what driving is.
This matters more for electric cars than it ever did for combustion ones. A petrol car's consumption varies with the cycle too, but nobody buys one on its tank range. An electric car is sold on the number, and the number is a laboratory result. If the units themselves are the confusing part, start with kW against kWh.
What each cycle actually measures
All four are laboratory procedures run on a rolling road, not road tests. What separates them is the speed profile they drive, how long it lasts, and what else is switched on while they do it.
NEDC is the oldest and the least like driving. It was built in the 1980s from steady, synthetic acceleration ramps, and its gentle profile is why NEDC figures ran so far ahead of what owners saw. Europe withdrew it for WLTP, and China withdrew it for CLTC.
WLTP replaced it with a longer, faster, more varied profile built from real driving data, including a high-speed phase above 130 km/h. It is the European type-approval figure.
CLTC is built from Chinese urban driving data, and that is the whole story: Chinese traffic is slower, so the cycle is slower, so an electric car looks better on it. Low speed suits a battery electric car, because aerodynamic drag rises with the square of speed and there is no idling loss to pay.
EPA is the outlier. The United States procedure runs five cycles rather than one, includes cold and hot ambient tests and air conditioning, and then applies an adjustment factor on top. It is the closest of the four to what a driver sees, and it produces the lowest numbers.
So what is the conversion?
There is not one, and this is the part worth holding on to.
The ordering is reliable: for the same car, CLTC will usually read highest, then NEDC, then WLTP, with EPA lowest. The size of the gap is not reliable. It depends on the car's drag coefficient, its mass, its battery chemistry and how its thermal management behaves at the temperatures each cycle specifies. A slab sided van and a low, slippery saloon do not lose the same proportion when the cycle speeds up.
Published rules of thumb exist, and every one of them is an estimate dressed as arithmetic. Multiplying a CLTC figure by a fixed factor produces a number that is not a rating from any authority and cannot be checked against one.
What this means when you read a comparison
If two cars carry range figures from different cycles, the honest comparison is that there is no comparison. That is why the comparison tables on this site refuse to declare a winner on range when the two figures come from different procedures, and say so in the row rather than quietly picking one.
The question to ask of any range claim is not how big it is. It is which cycle produced it, and whether the car it is being set against was measured the same way.
Sources
Terms defined here
- WLTP
- Worldwide Harmonised Light Vehicles Test Procedure. The laboratory cycle used for type approval in the European Union since 2017, and the figure quoted on European price lists.
- CLTC
- China Light-duty Vehicle Test Cycle. The Chinese procedure that replaced NEDC for new type approvals from 2021. Lower average speed than WLTP, which flatters an electric car.
- NEDC
- New European Driving Cycle. Withdrawn in Europe in favour of WLTP and in China in favour of CLTC, but still attached to older listings and press material.
Related reading
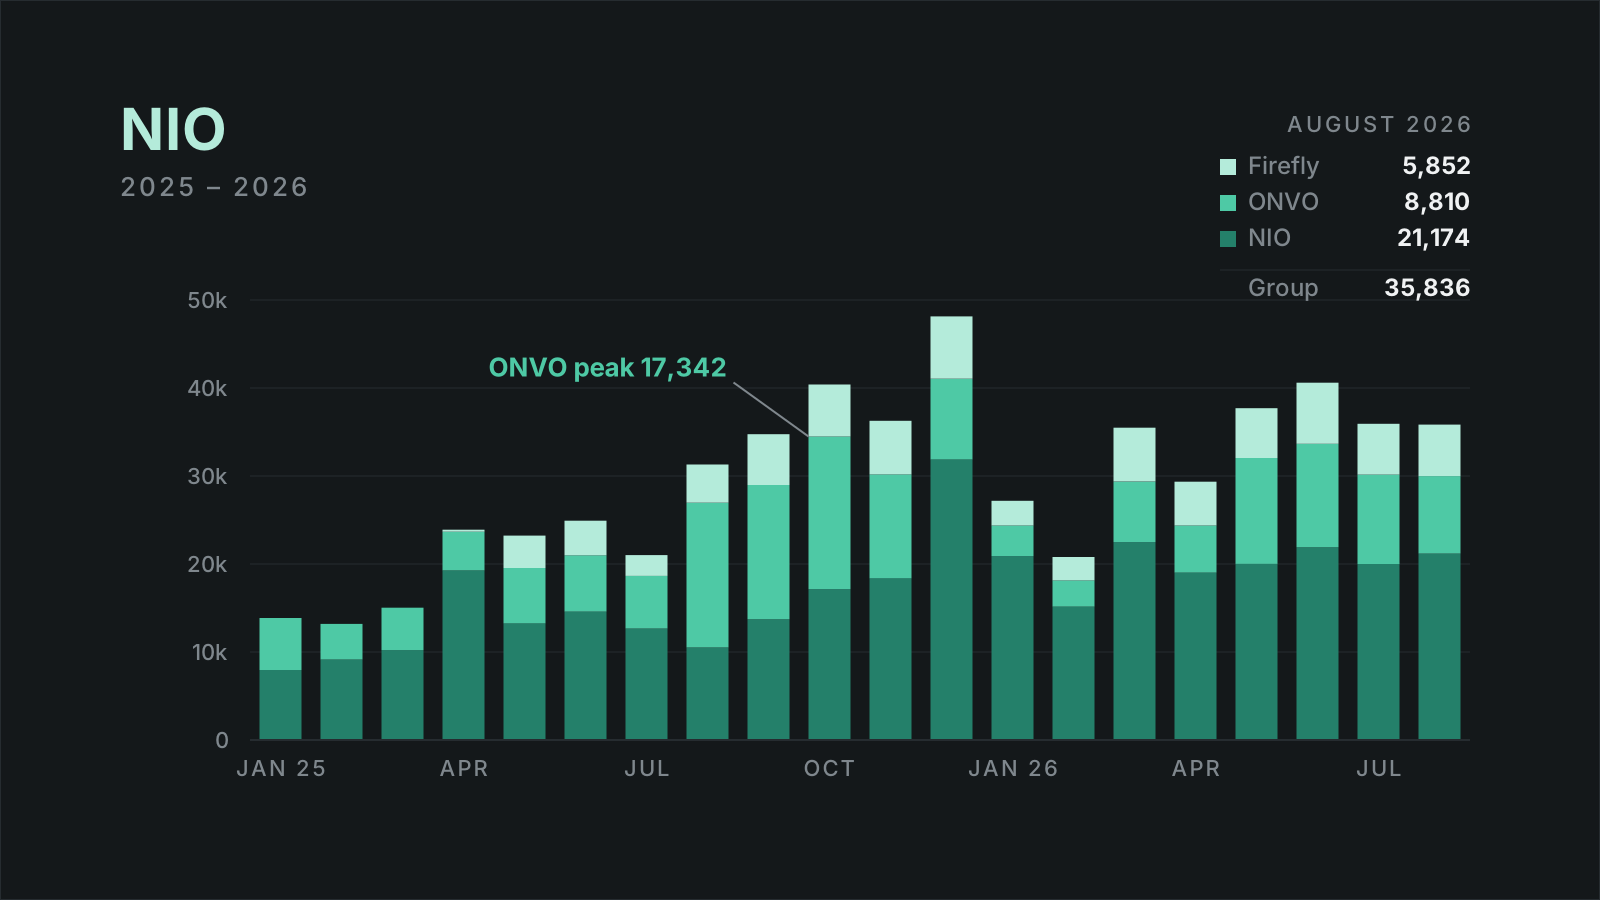
NIO's premium brand is doing the volume brand's job
Group deliveries rose 14.5% in August. Inside that number the expensive brand doubled and the cheap one halved - which is the reverse of what the strategy called for.
12 Sept 2026 · Analysis · 5 min
An electric motor, a petrol engine and a diesel engine, measured on efficiency
The three drivetrains differ in how much of their fuel reaches the wheels, where their torque arrives, and how many parts they need to do it. The efficiency gap is the largest of the three, and the least discussed.
Updated 17 Sept 2026 · Explainer · 2 min
Four plugs, three markets, and where the rectifier sits
The connector on the car is a regional decision, not a technical one. What actually separates charging types is whether the conversion from alternating to direct current happens inside the car or inside the charger.
Updated 17 Sept 2026 · Explainer · 2 min
More on NIO Inc
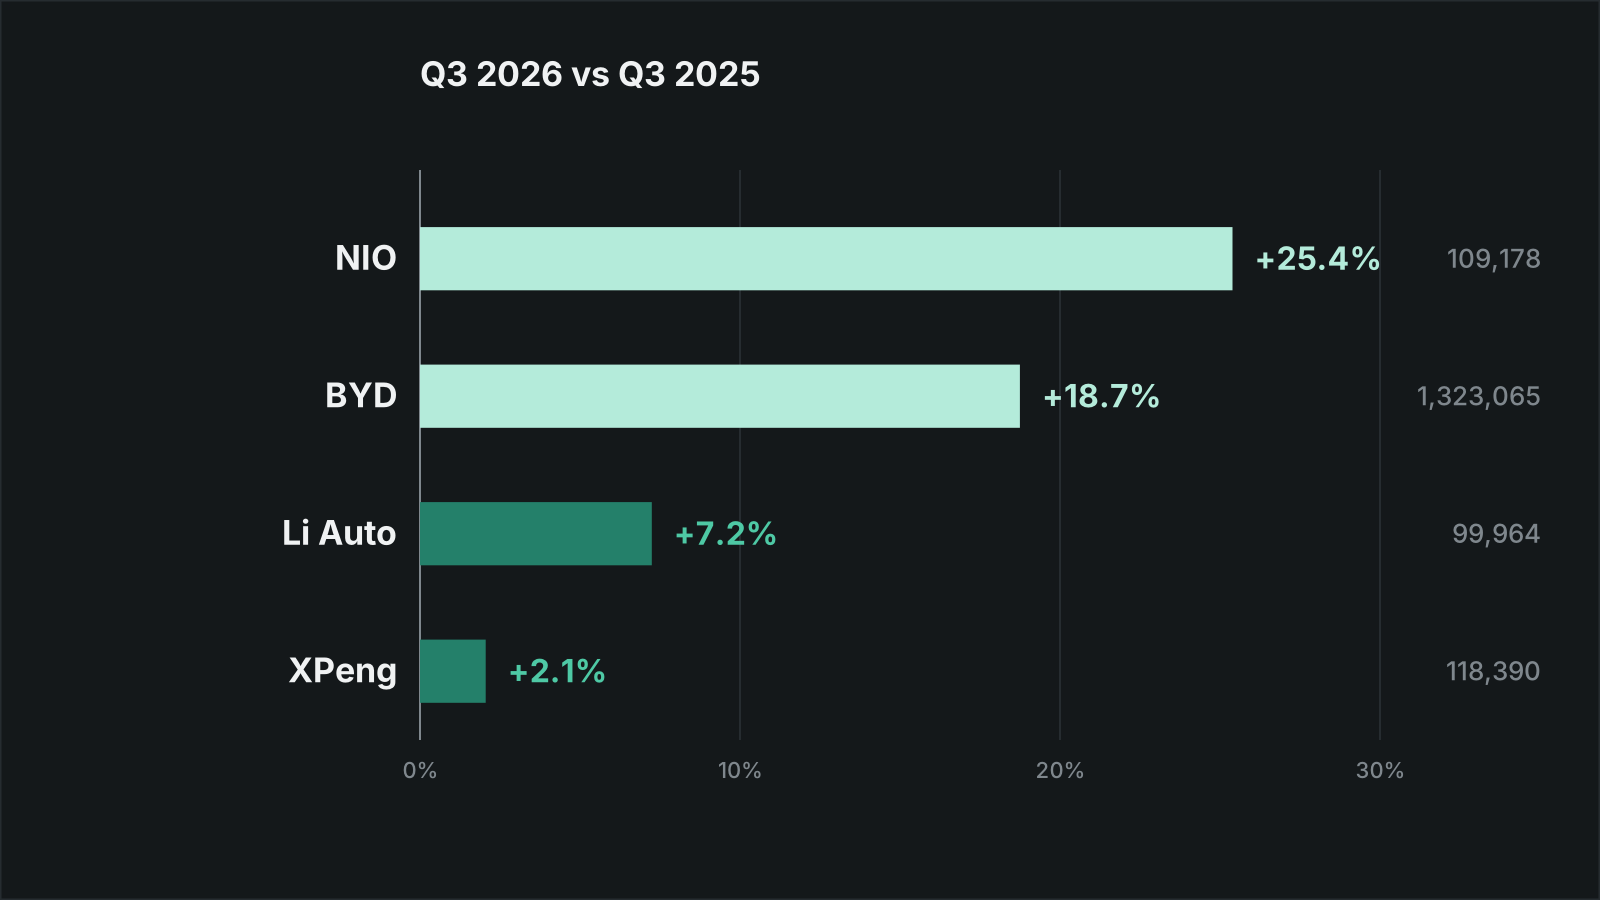
Q3 deliveries: NIO and BYD grew by double digits, XPeng and Li Auto did not
NIO delivered 109,178 vehicles in the third quarter (+25.4%) and BYD sold 1,323,065 (+18.7%). XPeng's 118,390 was up 2.1% and Li Auto's 99,964 up 7.2%. The growth came from NIO's premium brand and BYD's exports.
1 Oct 2026 · Analysis · 6 min
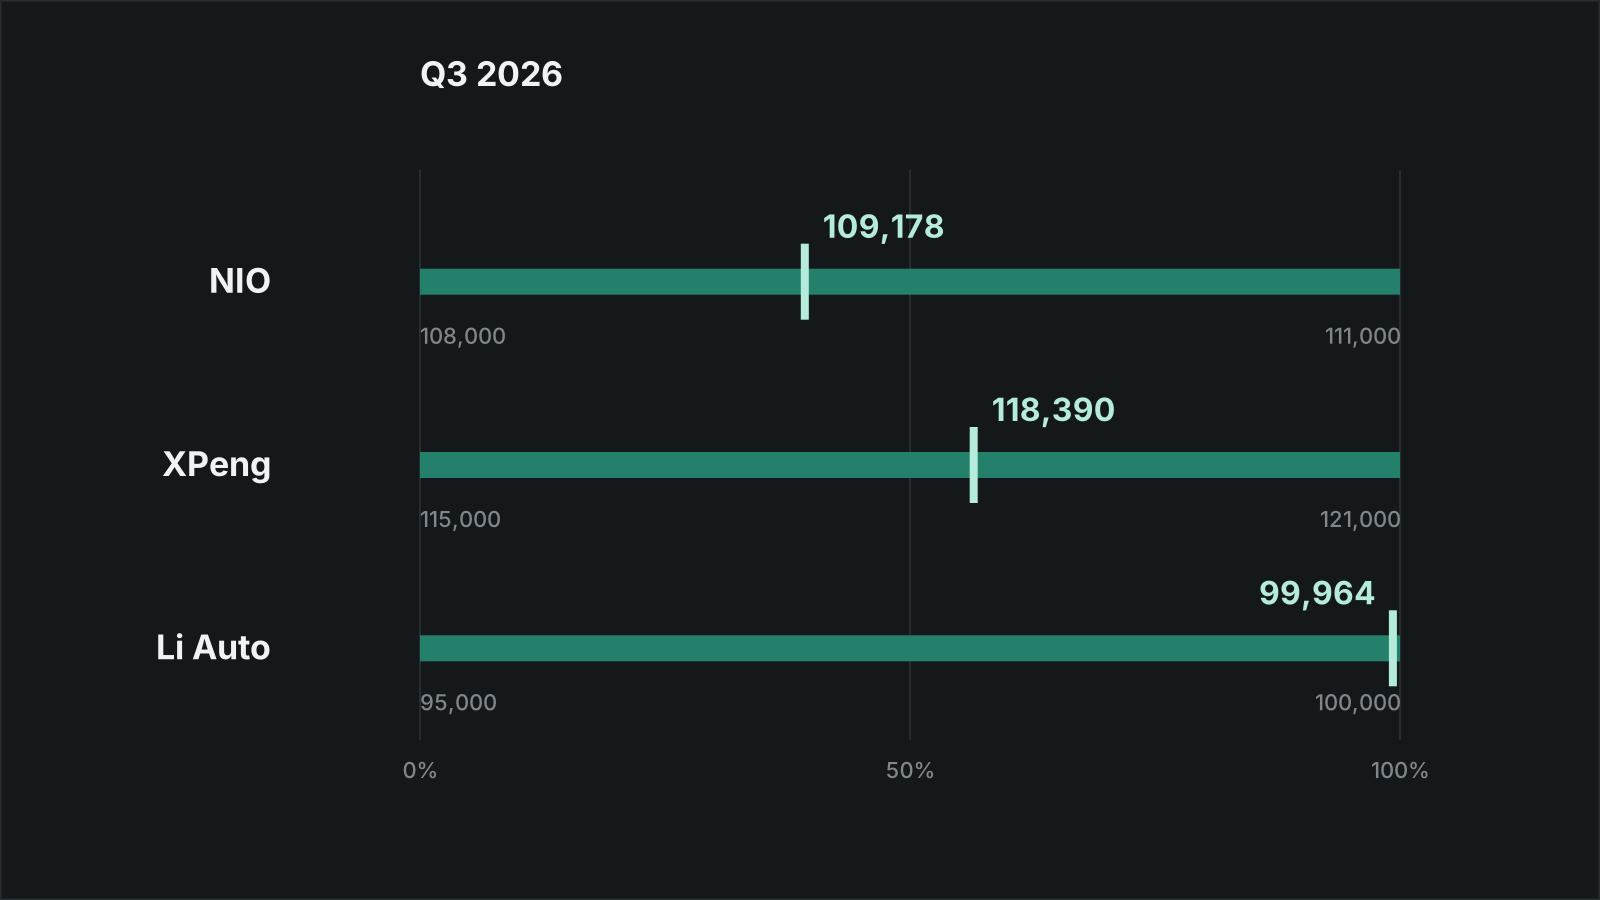
Q3 guidance scorecard: three hits, and Li Auto finished 36 vehicles from its ceiling
NIO, XPeng and Li Auto each delivered inside the third-quarter range they gave. NIO landed 39.3% of the way up its range, XPeng 56.5%, Li Auto 99.3%. All three set their ranges with part of the quarter already delivered.
1 Oct 2026 · Analysis · 6 min
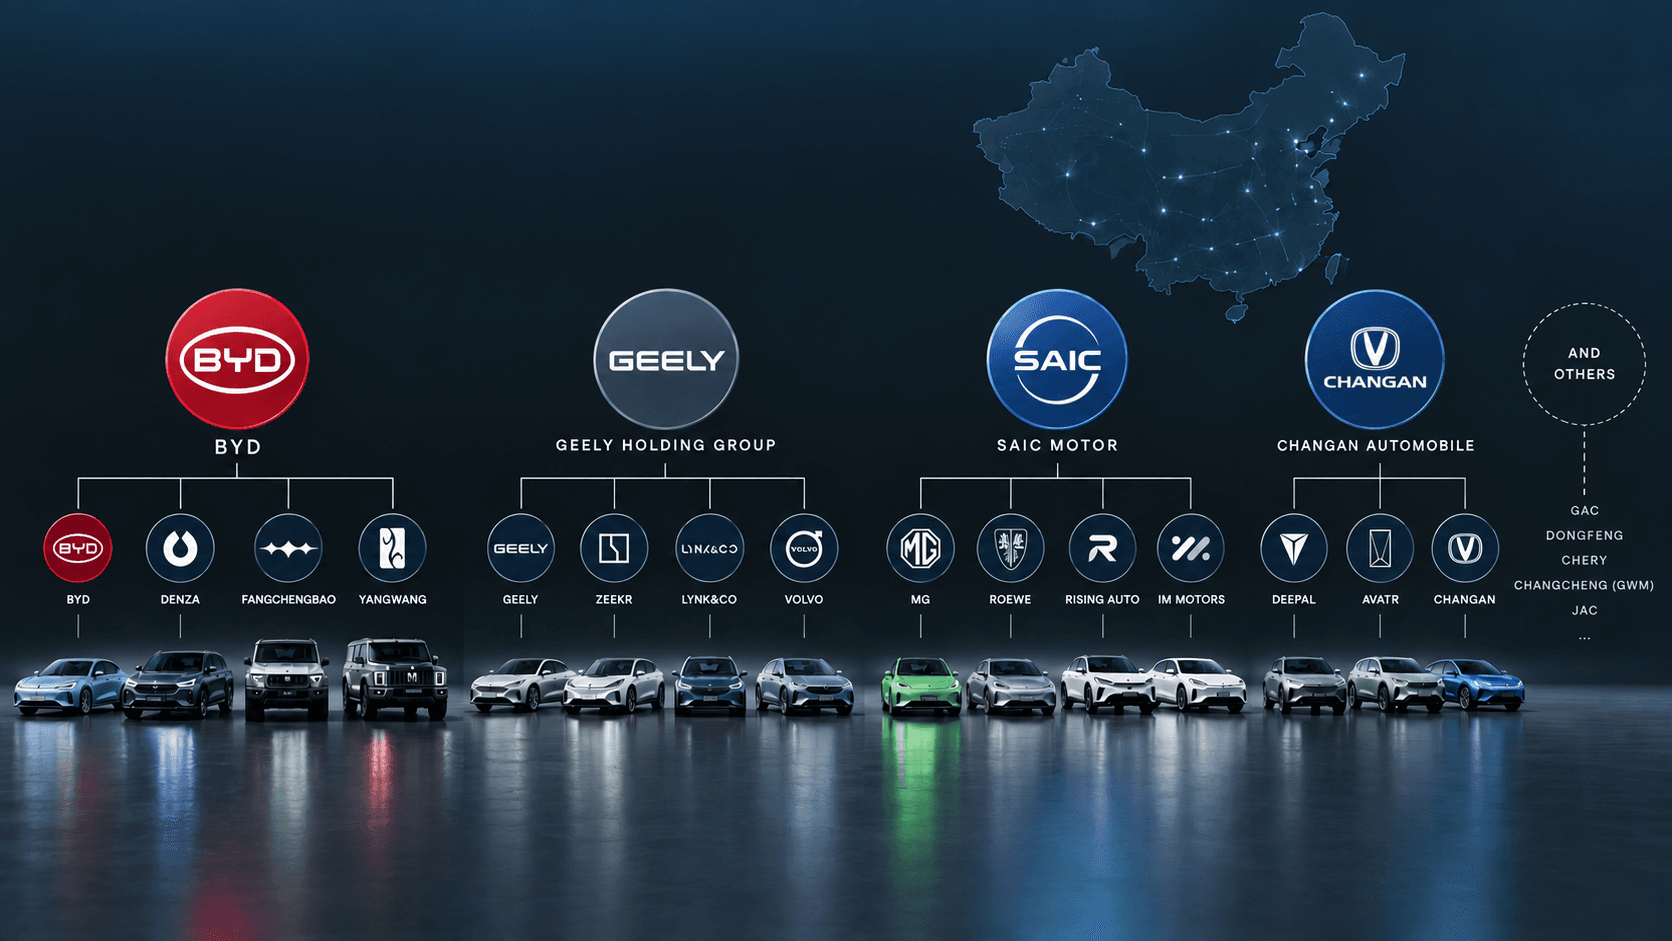
Chinese EV brands: who owns what
Denza, Yangwang, ONVO, MONA, Zeekr, Lynk & Co, MG, Avatr. Most of the names arriving in Europe belong to seven groups, one of which also owns Volvo, and one phone company that owns no carmaker at all.
12 Sept 2026 · Deep dive · 10 min
More on XPeng
What EV gross margin actually measures, and why the Chinese makers report it differently
XPeng's gross margin rose from 17.3% to 20.7% over a year in which its cars got less profitable, not more. Both numbers come from the same filing. Here is how that works.
12 Sept 2026 · Deep dive · 8 min